
Uses of SimSEE
SimSEE applications are multiple, the most common are described below.
Electric demand grows permanently. The generation plants already installed are being removed due to obsolescence and this leads to the need to constantly incorporate new generation projects.
Due to the size of the projects involved, these investments should generally be planned more than three years in advance. The planning of the systems is usually done by projecting the demand for the next decades and simulating the behavior of the system incorporating different types of generation (wind, solar, thermal, hydroelectric, etc.) to supply the demand increases and the withdrawal of generating existing units.
To carry out this task, in the same platform there is a powerful optimizer called OddFace in which the user can specify which are the investment alternatives and obtain the optimal investment plan.
With the Room that represents the system of the next decades it is possible to simulate the statistical behavior of the system in the set of possible futures (realization of stochastic processes) and obtain different indicators.
As an example, Fig.1 shows the expected generation by (MW-weekly means) for a possible expansion of the Uruguayan system in the horizon 2021-2047. Fig.2 shows for the same room, the expected annual marginal cost that is exceeded with probabilities of 30 and 70%. These examples are included for the sole purpose of transmitting to the reader the type of result that can be obtained when performing the simulations.
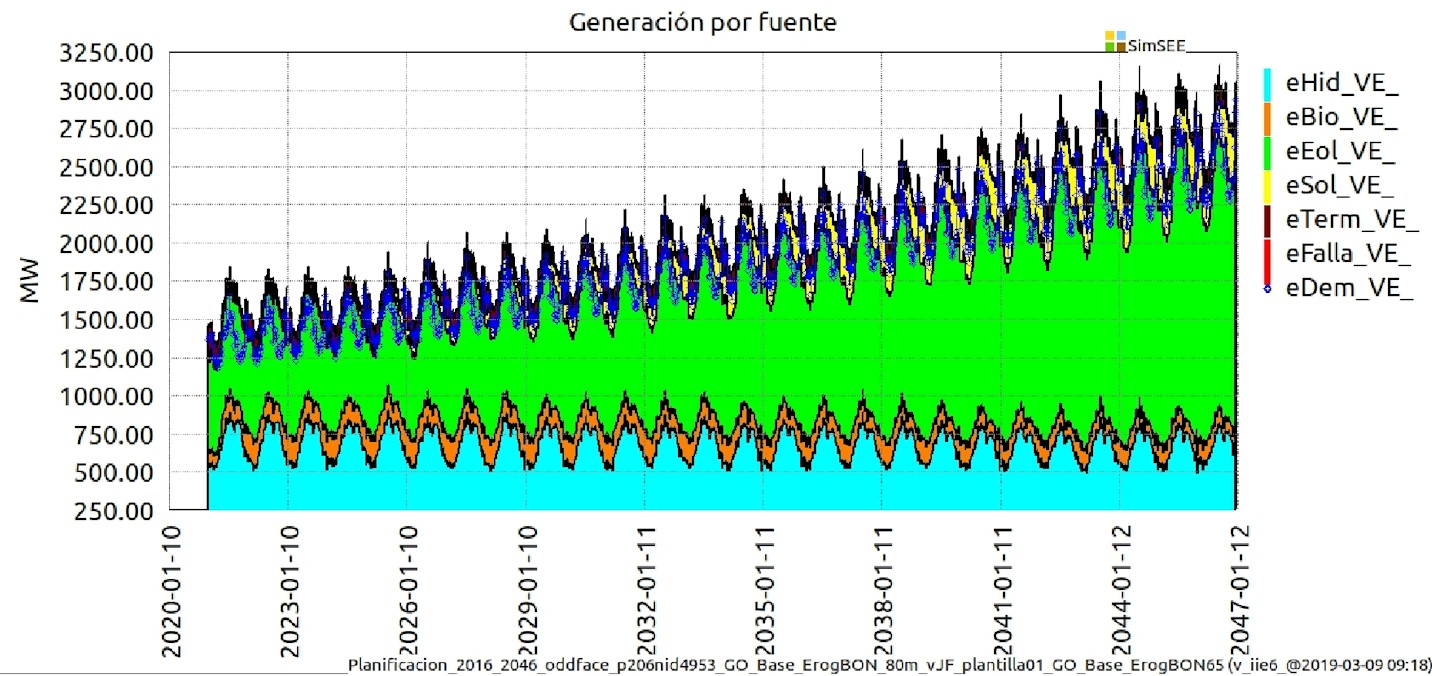
Fig. 1: Example of long-term simulation. Generation by source Uruguay 2021-2047.
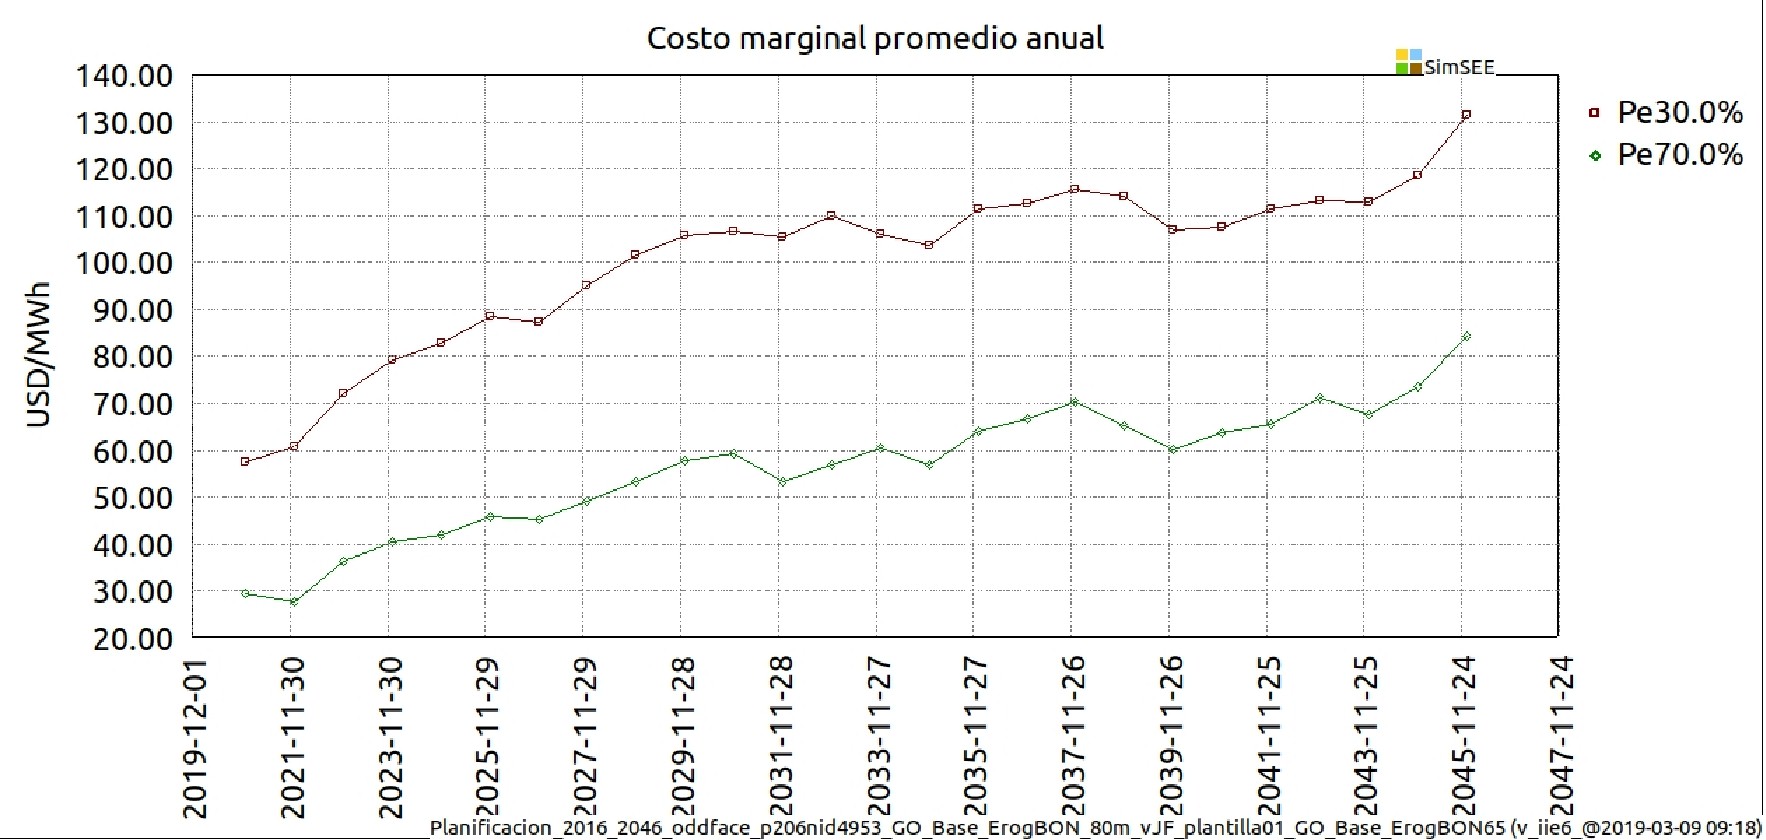
Fig. 2: Example of statistical indicator. Average annual marginal cost that is exceeded with probabilities of 30 and 70%.
Due to the size of the projects involved, these investments should generally be planned more than three years in advance. The planning of the systems is usually done by projecting the demand for the next decades and simulating the behavior of the system incorporating different types of generation (wind, solar, thermal, hydroelectric, etc.) to supply the demand increases and the withdrawal of generating existing units.
To carry out this task, in the same platform there is a powerful optimizer called OddFace in which the user can specify which are the investment alternatives and obtain the optimal investment plan.
With the Room that represents the system of the next decades it is possible to simulate the statistical behavior of the system in the set of possible futures (realization of stochastic processes) and obtain different indicators.
As an example, Fig.1 shows the expected generation by (MW-weekly means) for a possible expansion of the Uruguayan system in the horizon 2021-2047. Fig.2 shows for the same room, the expected annual marginal cost that is exceeded with probabilities of 30 and 70%. These examples are included for the sole purpose of transmitting to the reader the type of result that can be obtained when performing the simulations.
Fig. 1: Example of long-term simulation. Generation by source Uruguay 2021-2047.
Fig. 2: Example of statistical indicator. Average annual marginal cost that is exceeded with probabilities of 30 and 70%.
Based on long-term simulations, it is possible to calculate the income that a project would have (a new generation plant, a new transport line, etc.) by its incorporation into the system. The evaluation of projects can be done by the marginal income and expenses (this is assuming that the project is marginal in the system) or by the comparison of optimized long-term rooms as mentioned in the previous use.
The simulation of the following months of the optimal operation of the system allows the different participants (generators, operators, large consumers, etc.) to make forecasts of their sales and purchases and plan the availability of supplies (for example, the purchase of fuel, schedule shipping schedules for methane tankers, etc.).
As an example, in Uruguay, the Electricity Market Administration generates the Seasonal Programming report every six months using the SimSEE application and publicly displays the corresponding SimSEE Rooms on its website aquí.
As an example, in Uruguay, the Electricity Market Administration generates the Seasonal Programming report every six months using the SimSEE application and publicly displays the corresponding SimSEE Rooms on its website aquí.
In the case of organized markets based on a hourly price based on the marginal cost of generation, SimSEE can be used to calculate the expected value of the cost of acquiring energy in the spot market and the risk to which the buyer is exposed , indispensable values for the design of the price and risk associated with the contract.
SimSEE has a powerful stochastic process modeling tool. This tool allows you to incorporate in a simple way the available forecasts. As an example, in the programming of the operation of the system in Uruguay, forecasts of hydraulic contributions to hydroelectric power plants are considered, wind and solar generation and electricity demand. Incorporating the information of the forecasts to the Room that represents the system, it is possible to obtain the dispatch with hourly detail of the following days and obtain detailed statistical information.
With the constant increase of intermittent energy sources in the systems, these hour simulations of the following days provide indispensable information for the system operator. Figures 3 and 4 show examples of forecasts of wind generation and electrical demand for the next 7 days.
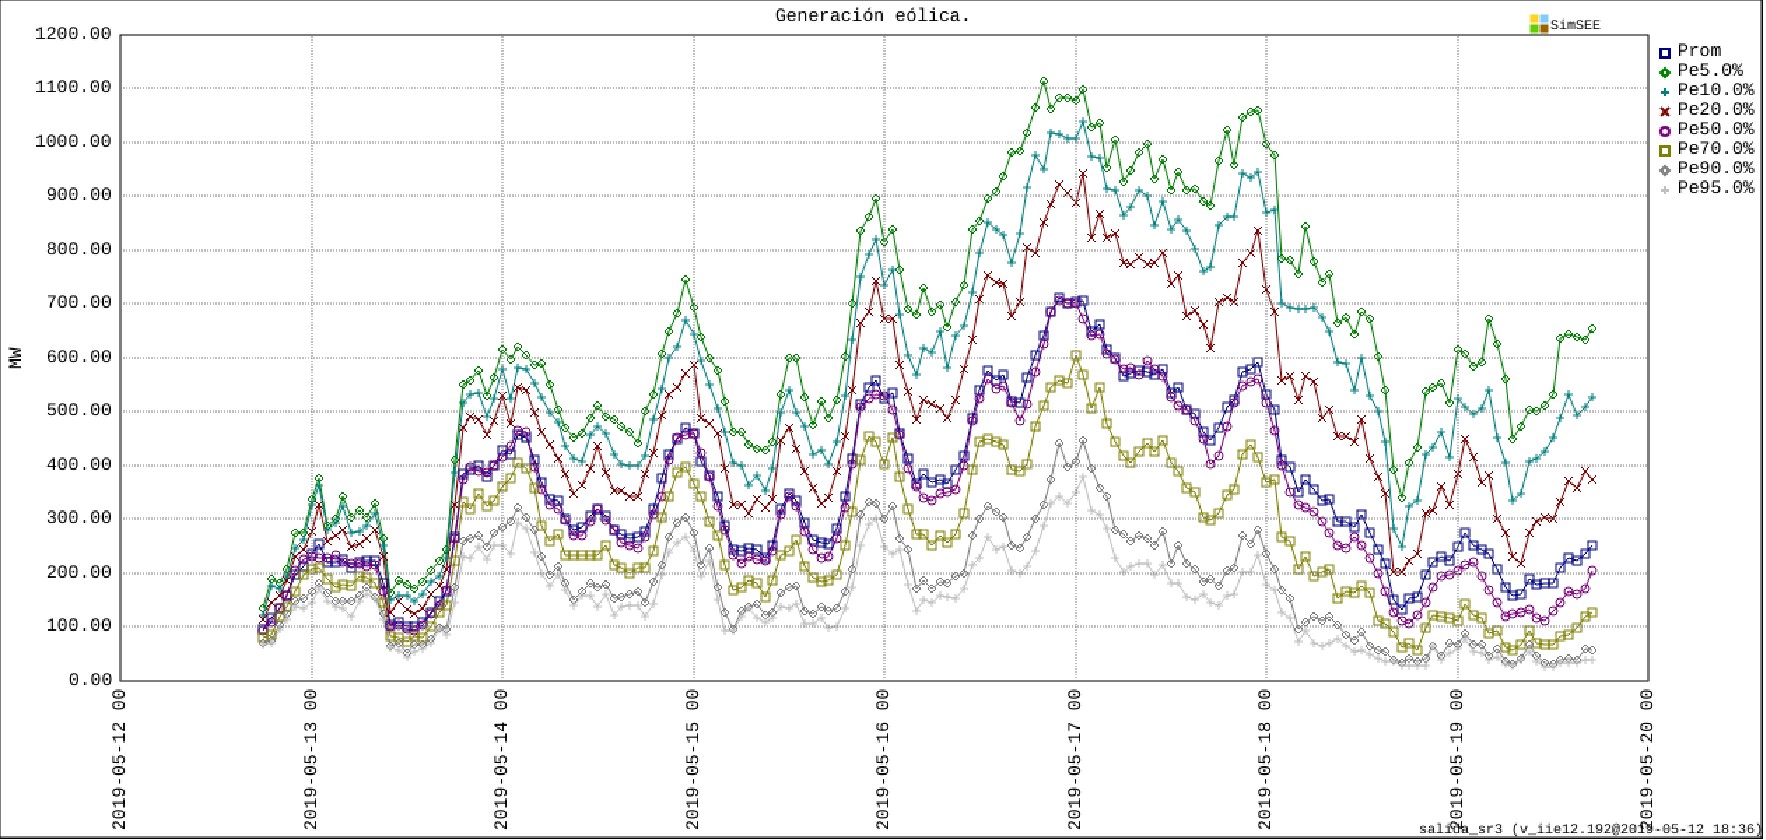
Fig. 3: Forecast of the wind generation of the following 7 days.
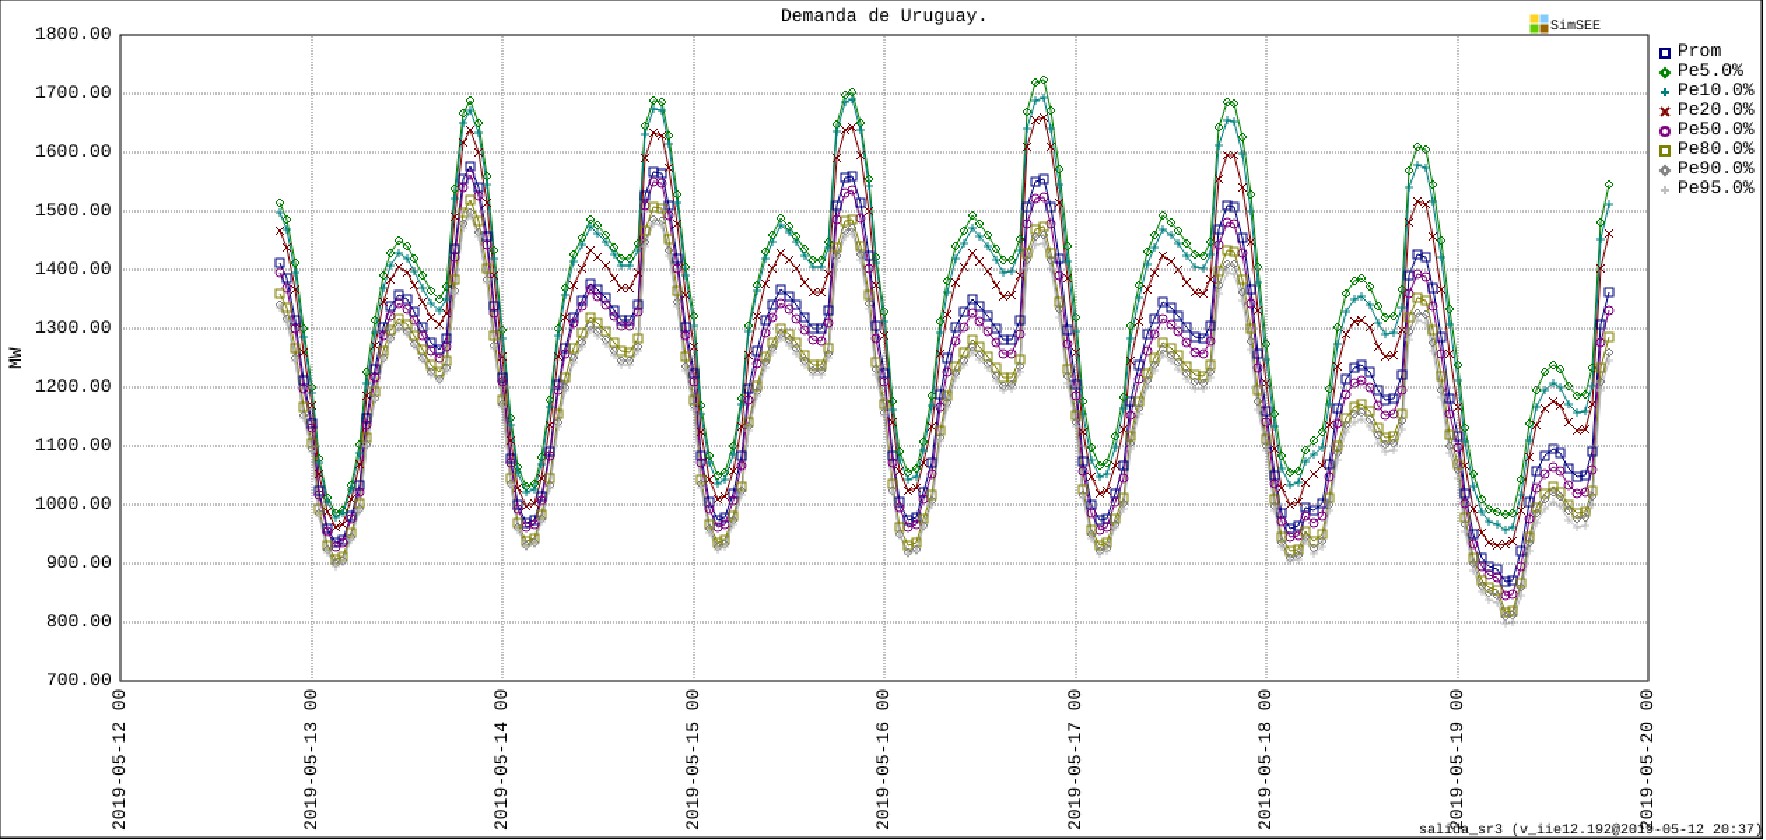
Fig. 4: Demand Forecast for the next 7 days.
From these short-term simulations, information relevant to the operation is obtained, such as the probability of dispatching a given plant in the following hours or days that allow for an orderly start-up. They also provide the necessary statistical information for the realization of exchange offers with other countries, being able to specify volume and price with confidence levels with days in advance..
With the constant increase of intermittent energy sources in the systems, these hour simulations of the following days provide indispensable information for the system operator. Figures 3 and 4 show examples of forecasts of wind generation and electrical demand for the next 7 days.
Fig. 3: Forecast of the wind generation of the following 7 days.
Fig. 4: Demand Forecast for the next 7 days.
From these short-term simulations, information relevant to the operation is obtained, such as the probability of dispatching a given plant in the following hours or days that allow for an orderly start-up. They also provide the necessary statistical information for the realization of exchange offers with other countries, being able to specify volume and price with confidence levels with days in advance..
As an example of SimSEE's continuous application, the Electricity Market Administration (ADME) of Uruguay has implemented an application called VATES, which is continuously updating an SimSEE Room with the representation of the Uruguayan generation system. Every hour, the Room is updated, incorporating the forecasts of hydraulic contributions to the dams, the forecast of wind generation (Eg Fig.3) and solar, the forecast of demand (Eg Fig.4). Information on the state of the system is also updated, such as the availability of power plants and the elevation of the hydroelectric lakes. After the Room is updated, SimSEE is executed to obtain the dispatch of the following seven days with hourly detail. In the case of ADME, this result is published automatically on its website aquí.
Fig. 3: Forecast of the wind generation of the following 7 days.
Fig. 4: Demand Forecast for the next 7 days.
Fig. 3: Forecast of the wind generation of the following 7 days.
Fig. 4: Demand Forecast for the next 7 days.
An example of the result of the application of simulations in continuous form as described in section 6 is that of the generation of the forecast of the marginal cost of generation with hourly detail of the following days.
In the example implemented by ADME, this marginal cost projection is updated every hour and could serve in the future as a basis for the implementation of price signals for intelligent home controllers that can manage some of the domestic burdens, such as the loading of vehicles. electrical and water heating in thermo-tanks. Or for industrial demands that may displace part of the consumption, such as some irrigation applications, refrigerators, etc.
Fig.5 shows an example of the publication of the marginal cost series published on ADME's website.
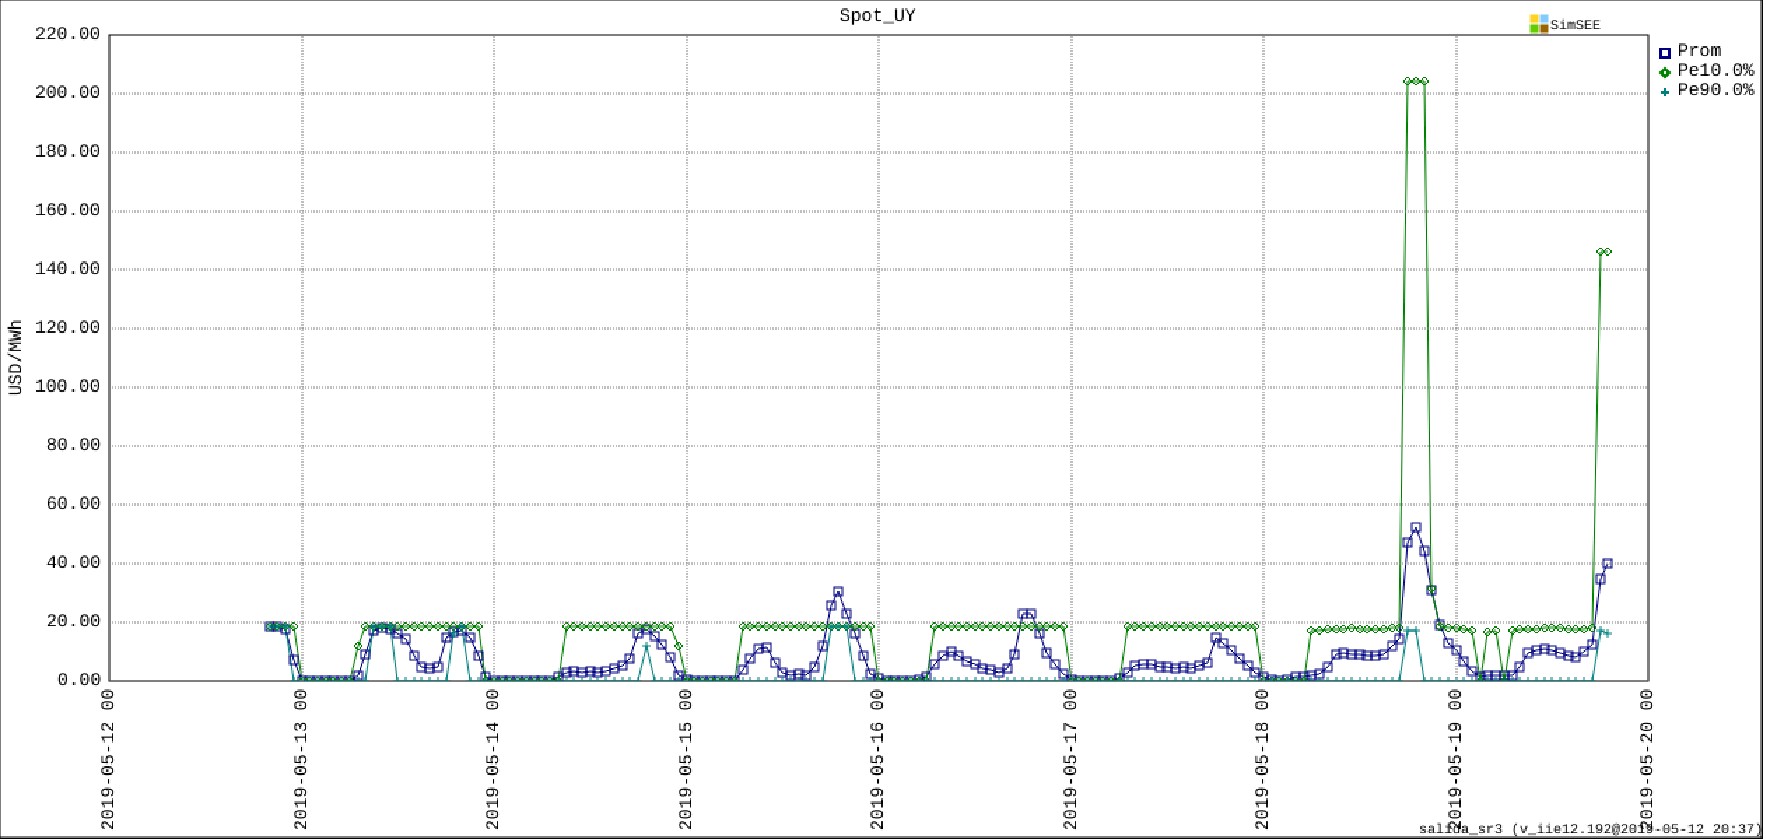
Fig. 5: Projection of the marginal cost of generation of the following 7 days.
The medium and long term simulations are mainly used by the Regulators for the estimation of the different cost components of the generation sector, which allows the design of parametric variation of the tariffs closely linked to the real cost components.
It has also been used to calculate the cost of congestion between areas of a system, obtaining an estimate of the rate that could be applied by transport to a future interconnection that increases the transport capacity between the areas.
It has also been used to calculate the cost of congestion between areas of a system, obtaining an estimate of the rate that could be applied by transport to a future interconnection that increases the transport capacity between the areas.